The following objects are masked from 'package:base':

    intersect, setdiff, setequal, union
library(tidyr)
library(purrr)
library(ggplot2)
library(myPackage)
data("unemp")
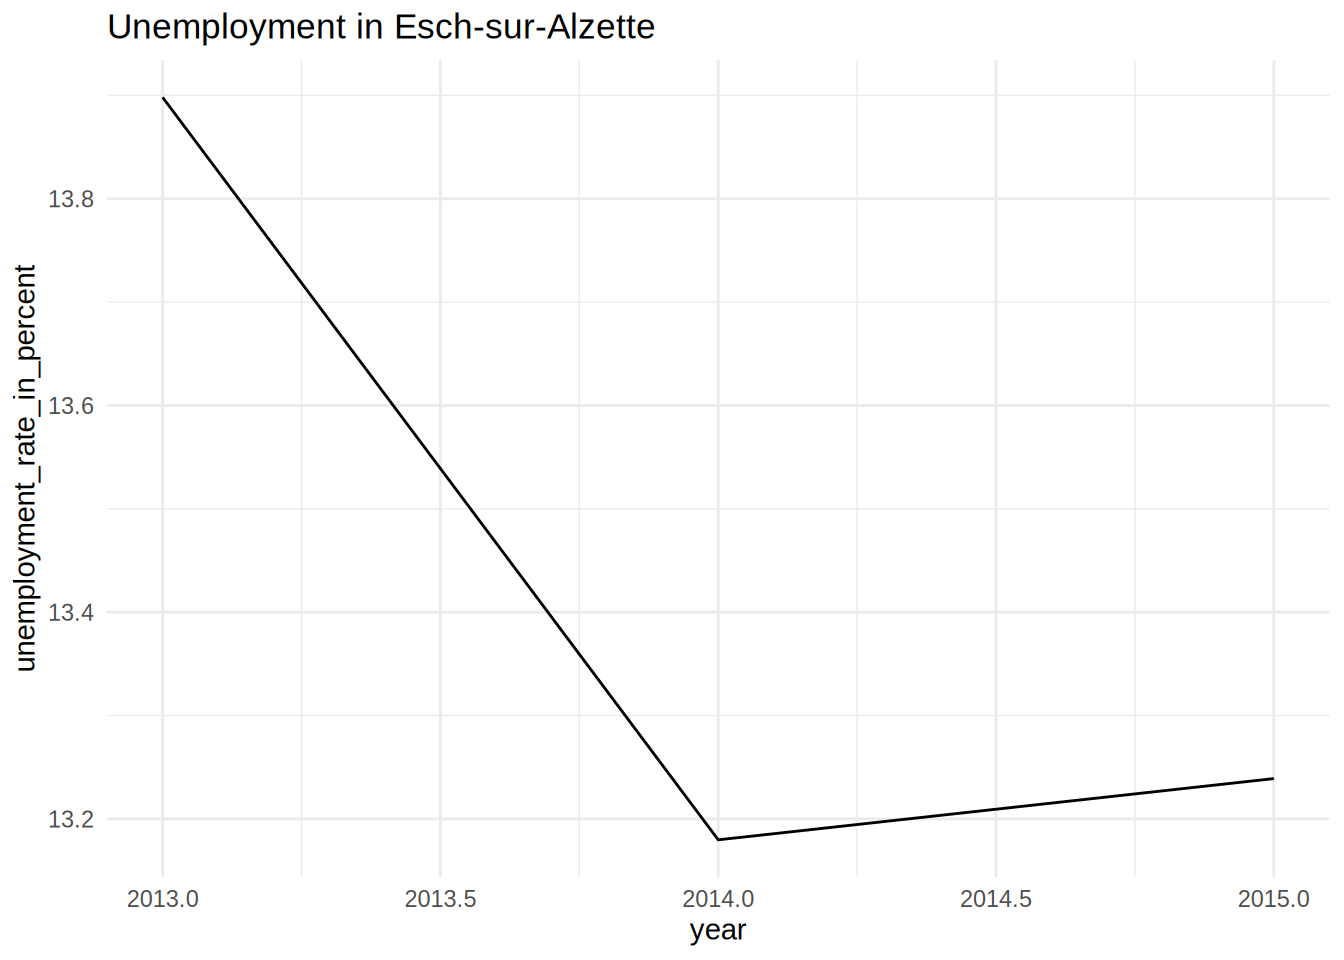
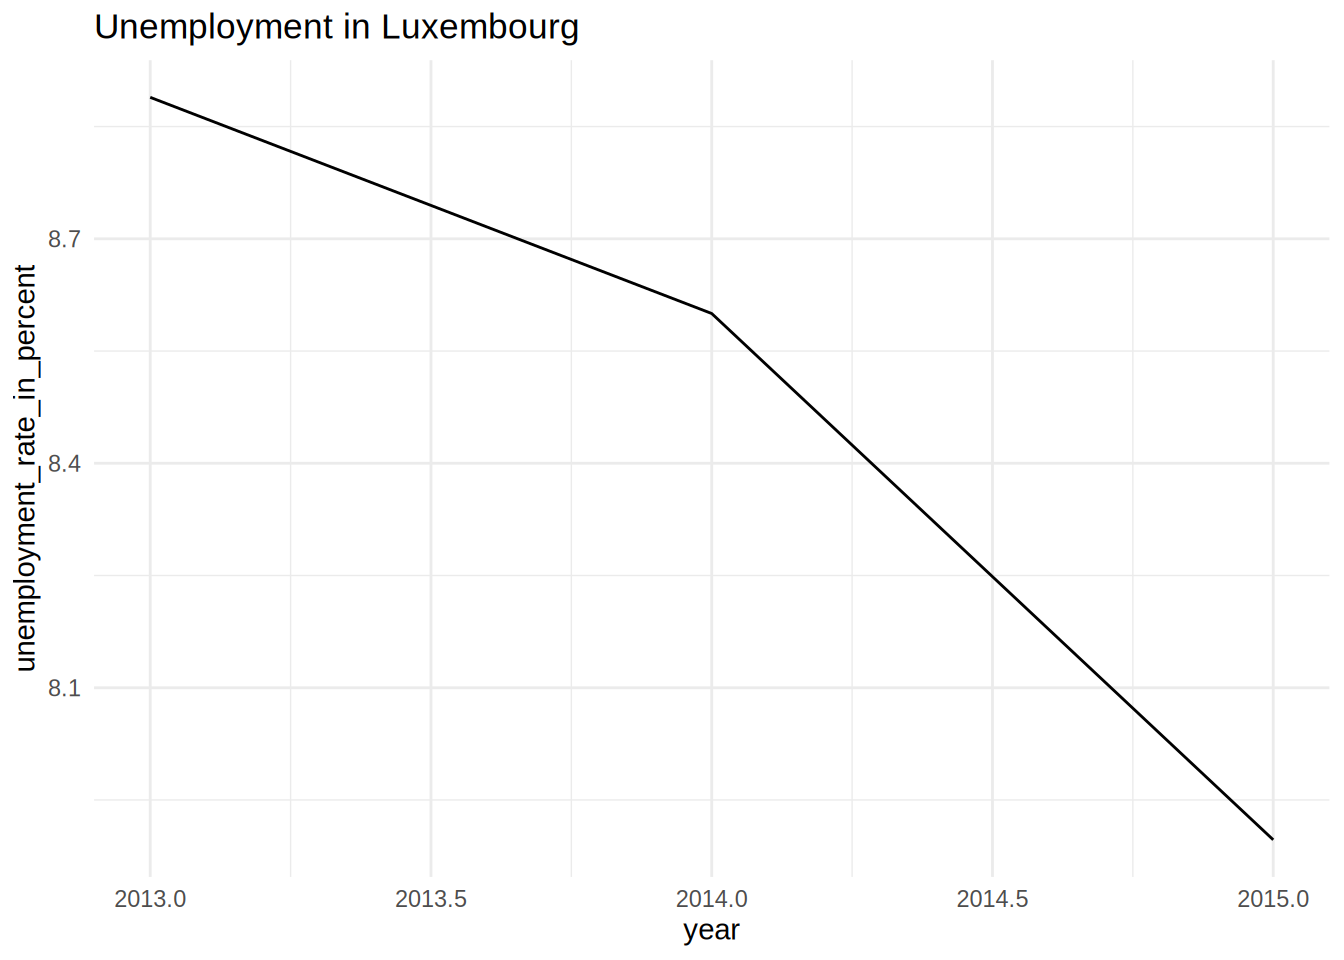
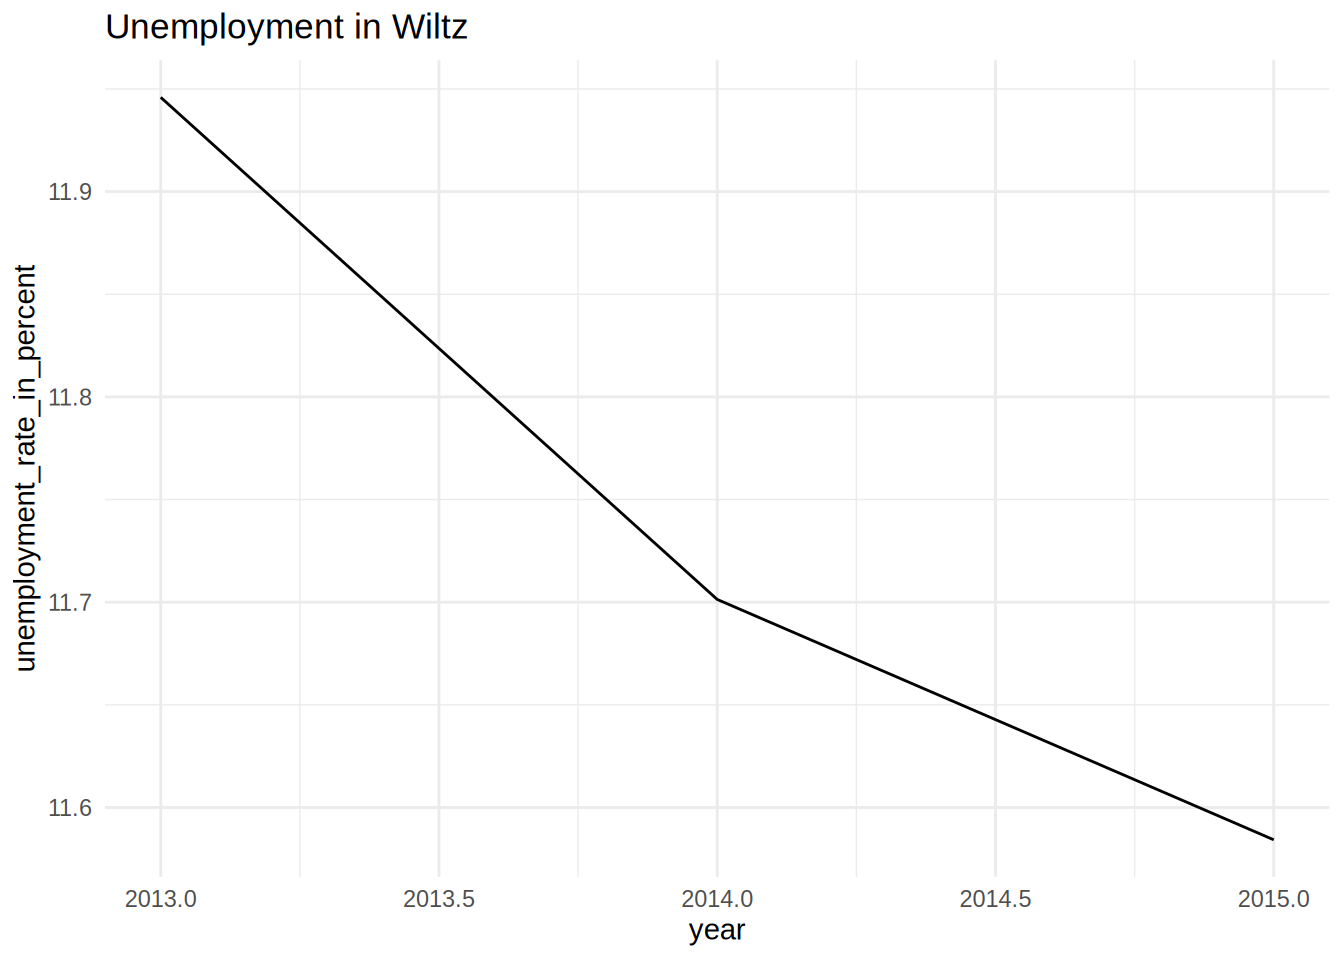
unemp %>%
janitor::clean_names() %>%
filter(level == "Commune",
place_name %in% c("Luxembourg", "Esch-sur-Alzette", "Wiltz")) %>%
group_by(place_name) %>%
nest() %>%
mutate(plots = map2(.x = data, .y = place_name, ~ggplot(data = .x) +
theme_minimal() +
geom_line(aes(year, unemployment_rate_in_percent, group = 1)) +
labs(title = paste("Unemployment in", .y)))) %>%
pull(plots)